Performance Visualizations
This page showcases various performance metrics and visualizations for the mohituQ algorithms.
DQI Algorithm Performance
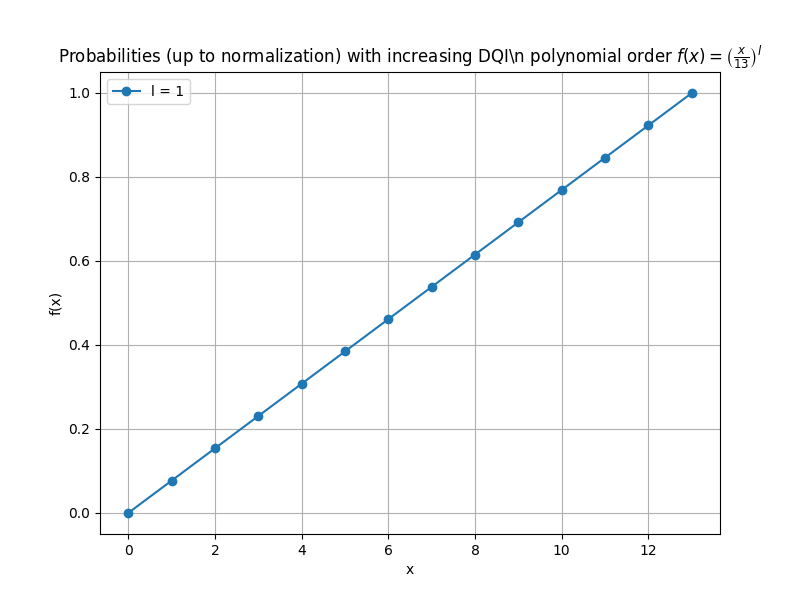
Performance benchmarks for the DQI algorithm on Max-XORSAT problems
The above chart shows how the DQI algorithm performs on various problem sizes.
Metrics Explained
Success Rate: The percentage of runs where the optimal solution is found
Time to Solution: The average time required to find the optimal solution
Quantum Advantage: The speedup compared to classical solvers
For more detailed analysis, please see our research papers referenced in the Acknowledgments section.